7.10. Mapping
7.10.1. Results are not imported in QGEP
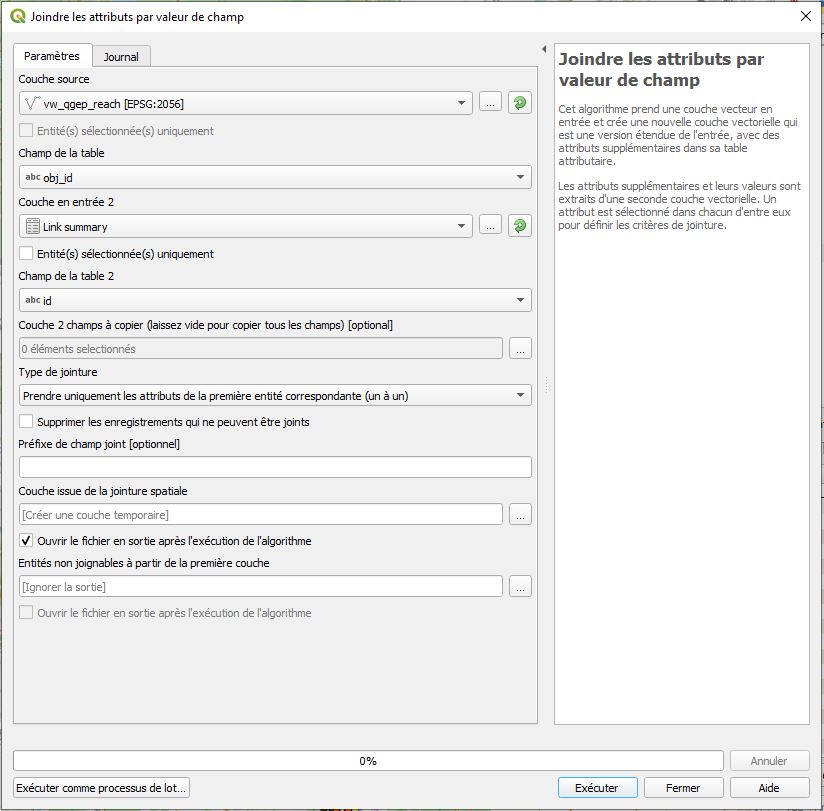
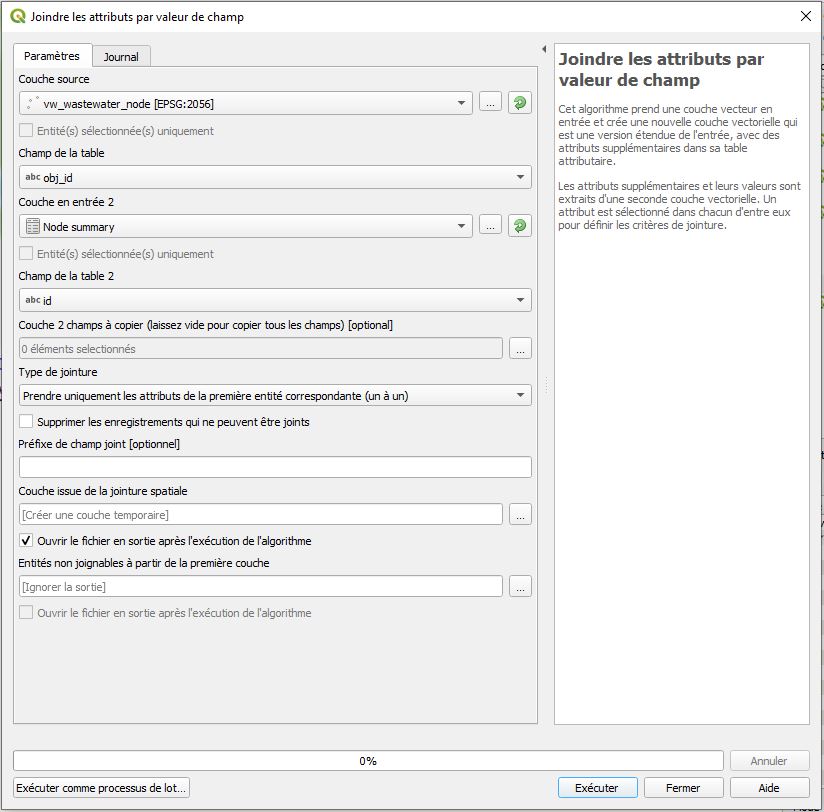
Use processing tool join attributes to add the results stored in the tables Node summary and Link summary to the tables qgep_od.vw_wastewater_node and qgep_od.vw_qgep_reach.
The mapping should be done on the attribute obj_id of the qgep_od tables and the attribute id of the summary tables.
7.10.2. Results are imported in QGEP
Add the layers qgep_swmm.node_results and / or qgep_swmm.link_results to your QGIS project
Filter by the name of the simulation and the name of the parameter to show: Right click on the layer > filter > Expression:
"swmm_simulation_name" = 'name of the simulation AND "swmm_parameter" = 'inflow'
Two template QGIS files are provided in the plugin folder src\swmm_templates\*.qgs
The project swmm_summary.qgs show how the summary indicators can be loaded in QGIS. The project swmm_full_report.qgs show how the full time series can be loaded in QGIS. You will need to adapt the services and the filters.
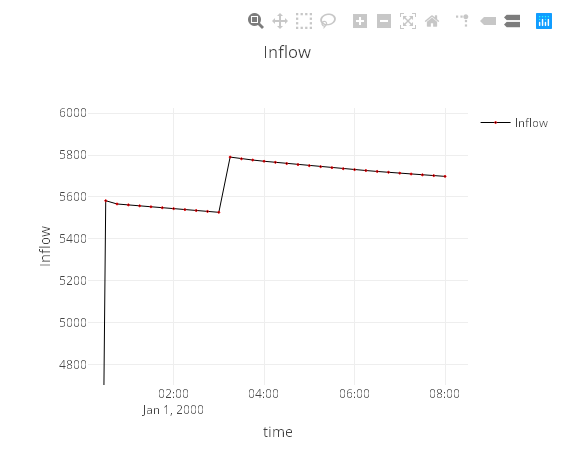
7.10.2.1. Show the indicators evolving along time
This manipulation only works with complete times series. Namely, you need to import the full results and not only the summary.
Play the simulation with Time Manager
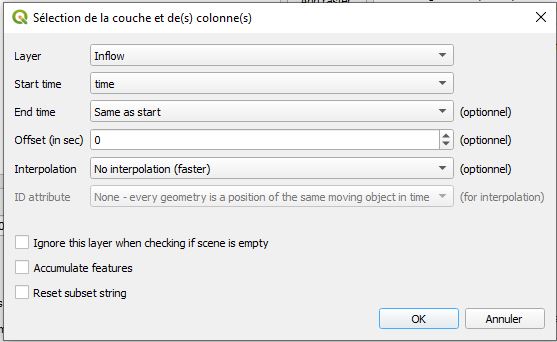
Install / activate the plugin Time Manager
- Parameter > Add a layer
Start time: time
End time: Same as start
Time frame size: Same as the swmm export time step
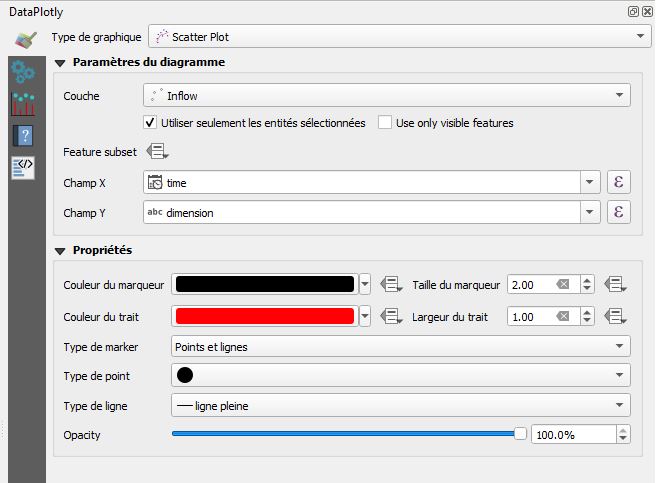
Plot values along the time with DataPlotly
Install / activate the plugin DataPlotly
Graph type: Scatter Plot
Activate: Use only selected features
Choose the layer
Field X: time
Field Y: value
Marker type: Line
Select the object that you want to plot: every nodes or links with the same id (you can select them from the map or from the table).