3.5. Outils de poursuite de réseau
3.5.1. Rafraîchir la topologie du réseau
Before using the network following tools, be sure that your network topology is updated
To refresh the network topology, click the Refresh network topology tool (Button with SQL and drip)
Le message Success: Network successfully updated s’affiche si cela a fonctionné
3.5.2. Flux amont
Peu importe la couche sélectionnée
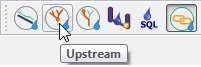
Pour débuter la poursuite de réseau amont, sélectionnez le bouton Amont dans QGEP et cliquez ensuite sur un noeud:
Une fenêtre de profil s’ouvre alors dans le bas de la carte. Cliquez sur le nœud de départ
S’il y a plus d’un noeud dans la zone, sélectionner le bon dans la liste
Attention
With qgepplugin 1.1.8 / QGIS 3.4.2, it’s a good idea to zoom in so far, that you can choose your start node without having any other node nearby. If you choose the node from the mouse-list, you may get unexpected results.
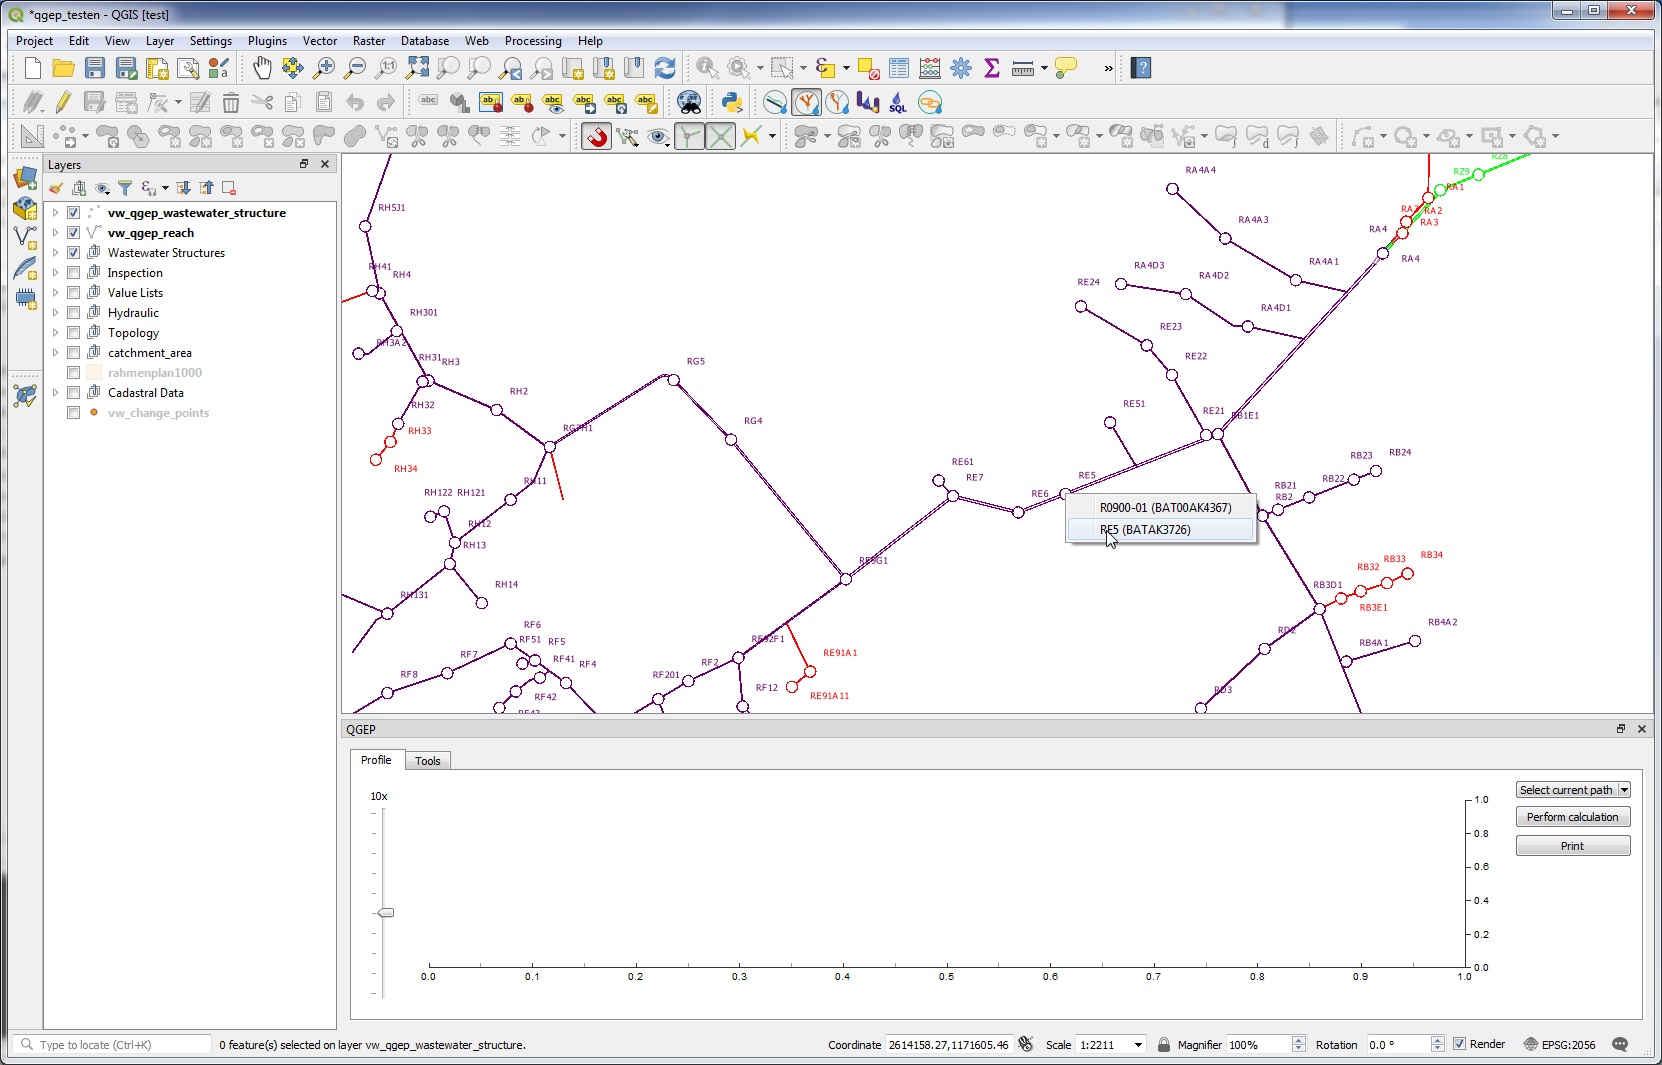
Au bout de quelques secondes, tous les tronçons du flux amont seront surlignés et vous pourrez visualiser la provenance des eaux.
If you want to select the highlighted reaches, then click on the Select current path button in the profile window
You can now work with your reach selection in the attribute table or zoom to the selected reaches (if the vw_qgep_reach layer is selected)
Use this tool to check if the topology of your network is correct.
Note
In the button select current path, you have a menu Configure Select. This is prepared to select later not only the path, put also the catchment areas that are connected to the path. This feature is not working with qgepplugin 1.1.8.
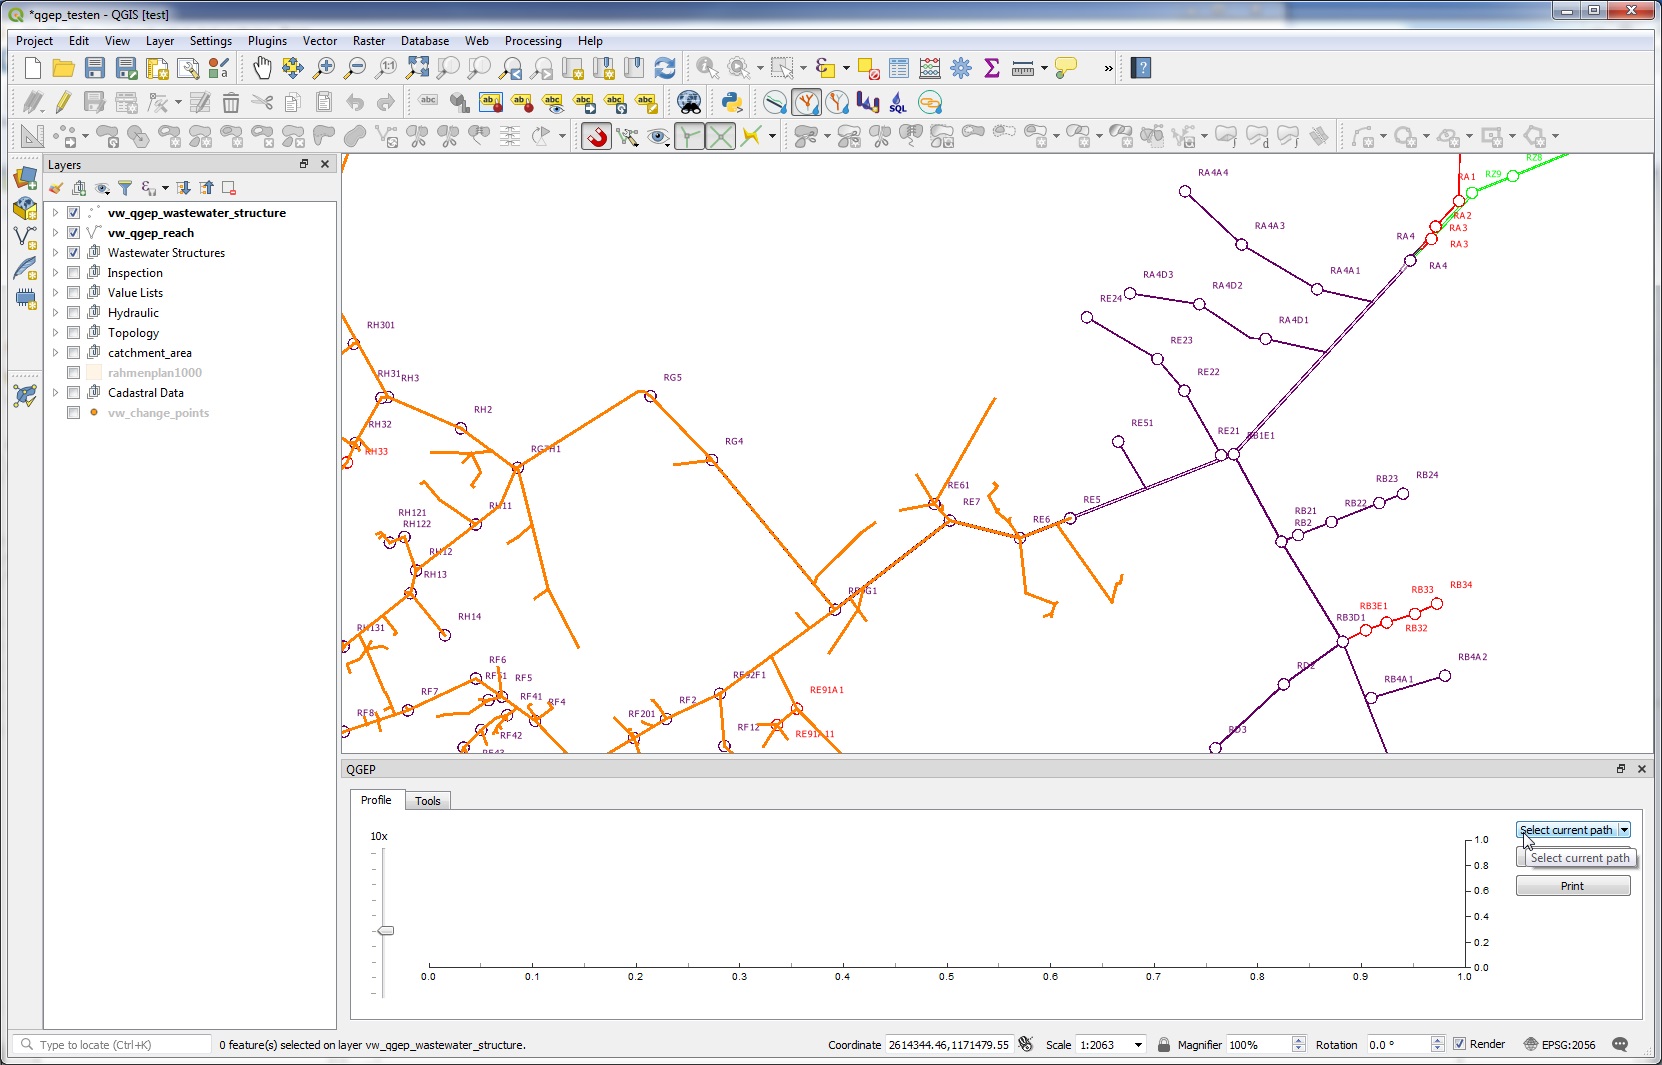
3.5.3. Flux aval
La poursuite de réseau flux aval fonctionne de la même façon que la poursuite de réseau flux amont décrite ci-dessus.
Vous pouvez voir l’écoulement de l’eau.
Control, if QGEP finds also the overflows
Utilisez ceci pour contrôler si la topologie de votre réseau est correcte ou pour découvrir à quel endroit vous pourriez intervenir en cas d’accident.
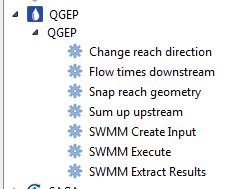
3.5.4. Sum up upstream
C’est un outil dans la boîte à outils QGEP.
The idea for this tool is to sum up a value over the whole network of channels, e.g. the flowtime for each point to the outlet of the network.
For this tool you need a field in the layer vw_qgep_reach with the values to sum up. Because interesting values are normally not part of this layer, you have first to join the value-field (e.g flowtime or flow rate) to the layer vw_qgep_reach.
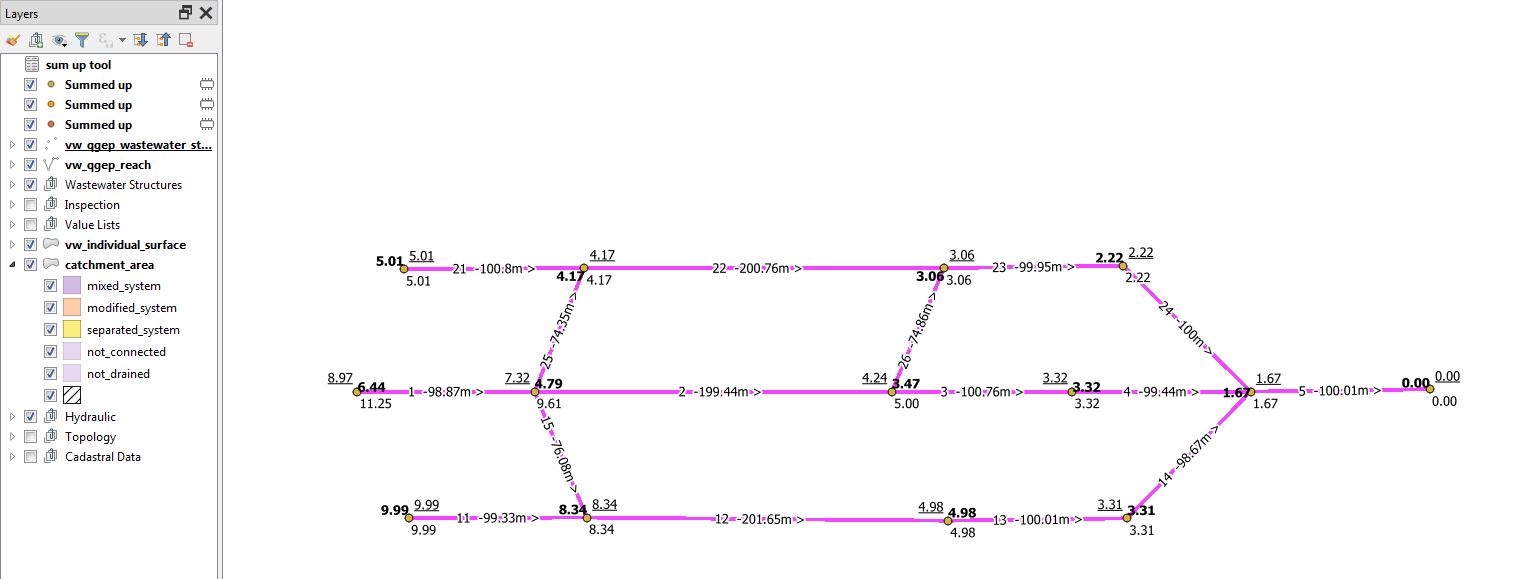
As example look at this small network, labeled with reach-identifier, length and flow direction arrow
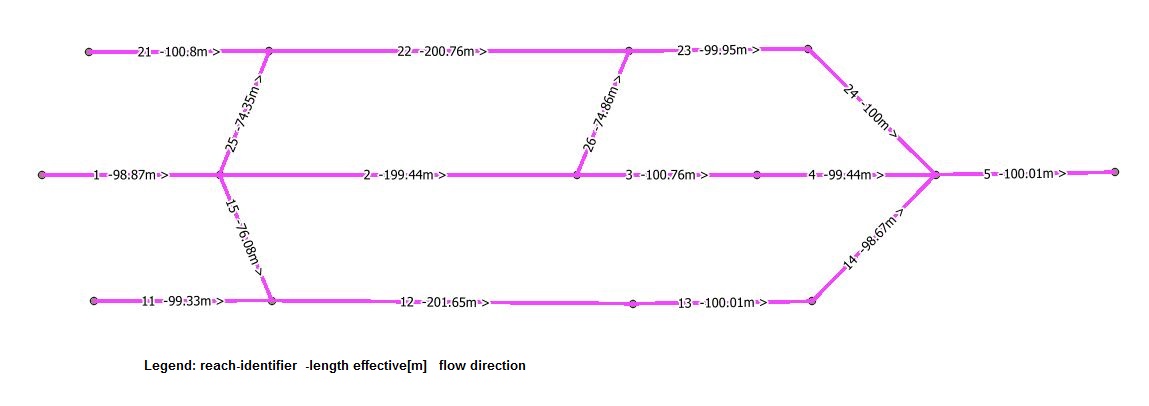
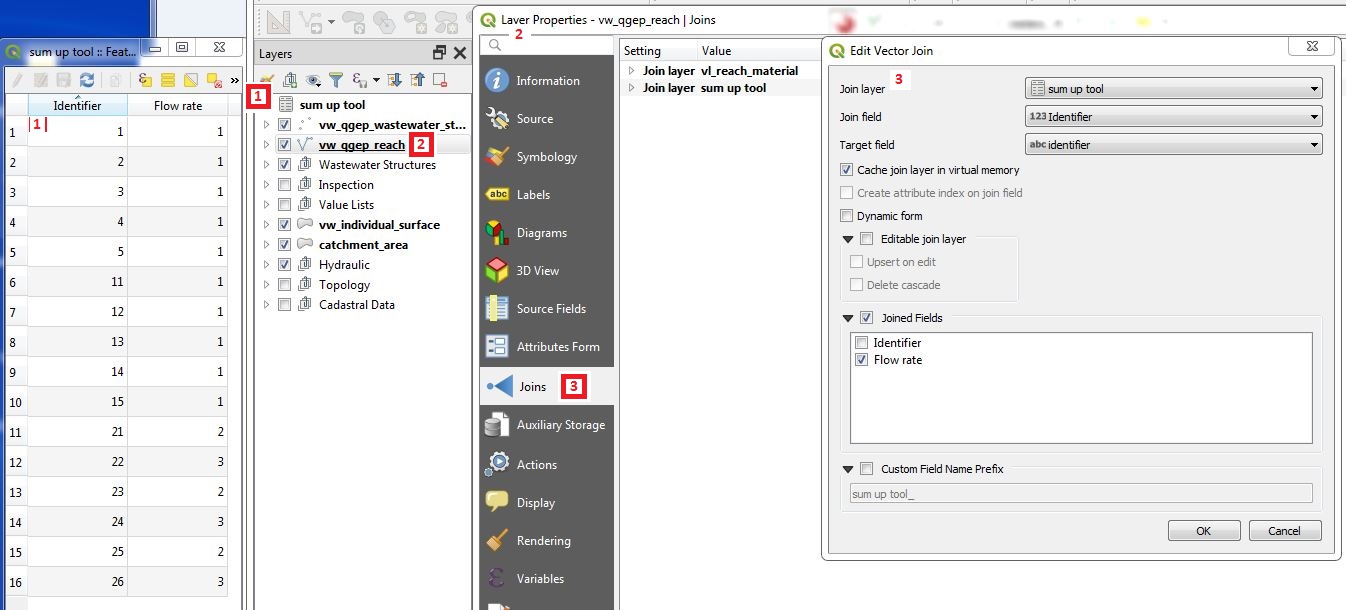
We need a table (in the example called sum up tool) with at least two fields: field identifier for the join and field flow rate (in the example in [m/s]) to sum up.
Open the properties of layer vw_qgep_reach, choose Joins and Add new join (green + Button) and define the join with the join field (identifier) and the joined fields (field to sum up).
Start the tool with double-click one Sum up upstream

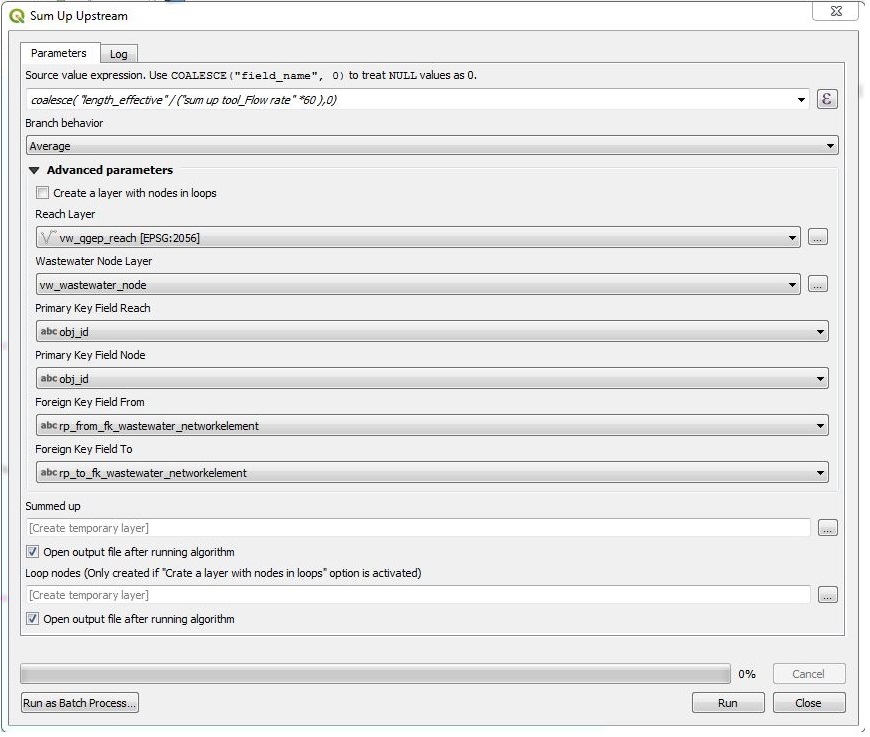
In the window you have to enter/to choose
an expression as shown in the title of the field (COALESCE(« field_name »,0). If you do not use the coalesce command, you will get an error when running the tool and there are NULL-values in the field to sum up. In the figure is as example the calculation for the flow time in [minutes], calculated with length effective and the flow rate in [m/s].
the branch behavior (Minimum, Maximum, Average): which value will be used after when two branches join to continue the summing.
the advanced parameters are preconfigured for QGEP and should not need to be changed.
Summed up: if you let this field empty, there will be a temporary point layer with the results in your project. Otherwise you can save the results to a new point vector layer.
The resulting point-vector layer has the fields of the vw_wastewater_node layer and an additional field value with the sum for each wastewater node. * In the figure below you see the result of the example with all three branch behaviors: minimum = normal style, maximum = bold, average = underscored
3.5.5. Temps d’écoulement en amont du réseau.
C’est un outil dans la boîte à outils QGEP.
The idea for this tool is to get the flowtime between a startpoint (where e.g.is an accident) and an interesting wastewater structure downstreams. It is not the idea to create a flowtime plan for a whole network with this tool (use the SumUpTool_ tool for this task).
Pour cet outil, vous avez besoin d’une couche (table) dans le projet QGEP qui comprend le temps d’écoulement par conduite et l’identifiant unique (obj_id) de chaque conduite.
Vous devez sélectionner la conduite de départ (p.e. à l’endroit ou à eu lieu l’accident) dans la couche vw_qgep_reach.
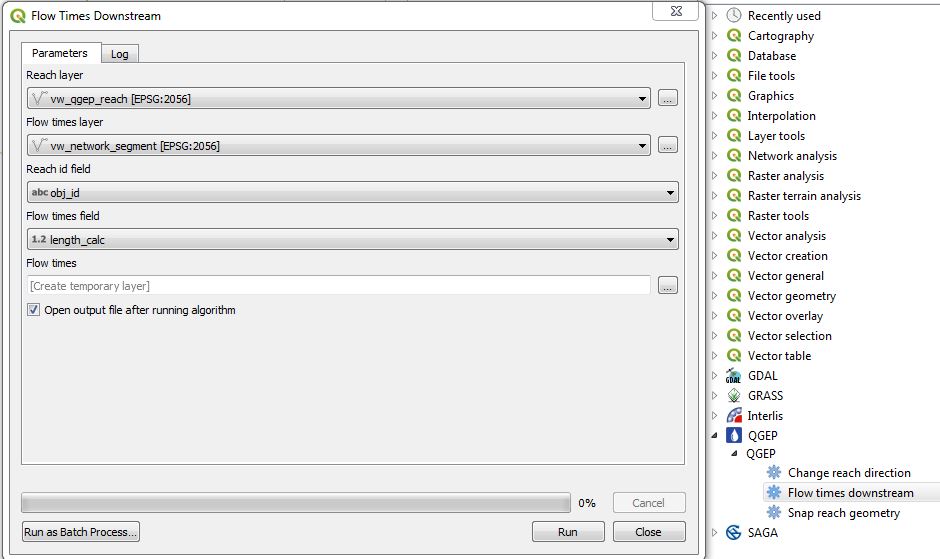
Démarré l’outil en double-cliquant sur Flow times downstream
Dans la fenêtre qui s’ouvre, choisissez
comme couche de conduite (reach layer): vw_qgep_reach
comme couche de temps d’écoulement: la table que vous avez créée avec le temps d’écoulement et l’obj_id de chaque conduite
comme champ d’identifiant pour la conduite: le champ dans votre table contenant les obj_id des conduites
comme temps d’écoulement: le champ qui contient les temps d’écoulement dans votre table
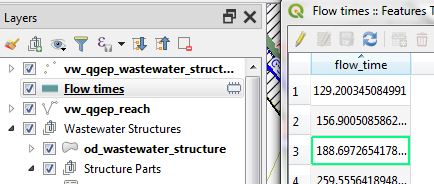
Si vous laissez le champ du temps d’écoulement vide, cela va créer une couche temporaire avec les résultats dans votre projet. Sinon vous pouvez l’enregistrer en temps que couche vecteur.
L’outil effectue une recherche de l’écoulement aval à partir de la conduite sélectionnée comme point de départ. Un champ par conduite est enregistré avec la somme des temps d’écoulement.
Attention
S’il y a plus d’un chemin possible pour l’écoulement aval, les résultats seront faux après l’embranchement.
Dans certain cas, le résultat pourra être nul et une erreur en rouge dans le journal des messages
Ne sélectionnez pas plus d’une conduite de départ
Ne sélectionnez pas vw_qgep_reach comme couche du temps d’écoulement
Une erreur sera soulevée si aucunes valeurs ne correspond à l’obj_id de la conduite