3.5. Network following tools
3.5.1. Refresh network topology
Before using the network following tools, be sure that your network topology is updated
To refresh the network topology, click the Refresh network topology tool (Button with SQL and drip)
If ok, there is a message: Success: Network successfully updated
3.5.2. Upstream
It does not matter, which layer is selected
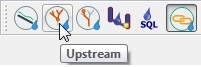
To start upstream network following select the Upstream QGEP button
QGEP opens then profile window at the bottom of the map. Click on your start node.
If there is more than one node in this area, you choose the one you want form the mouse-list
Attention
With qgepplugin 1.1.8 / QGIS 3.4.2, it’s a good idea to zoom in so far, that you can choose your start node without having any other node nearby. If you choose the node from the mouse-list, you may get unexpected results.
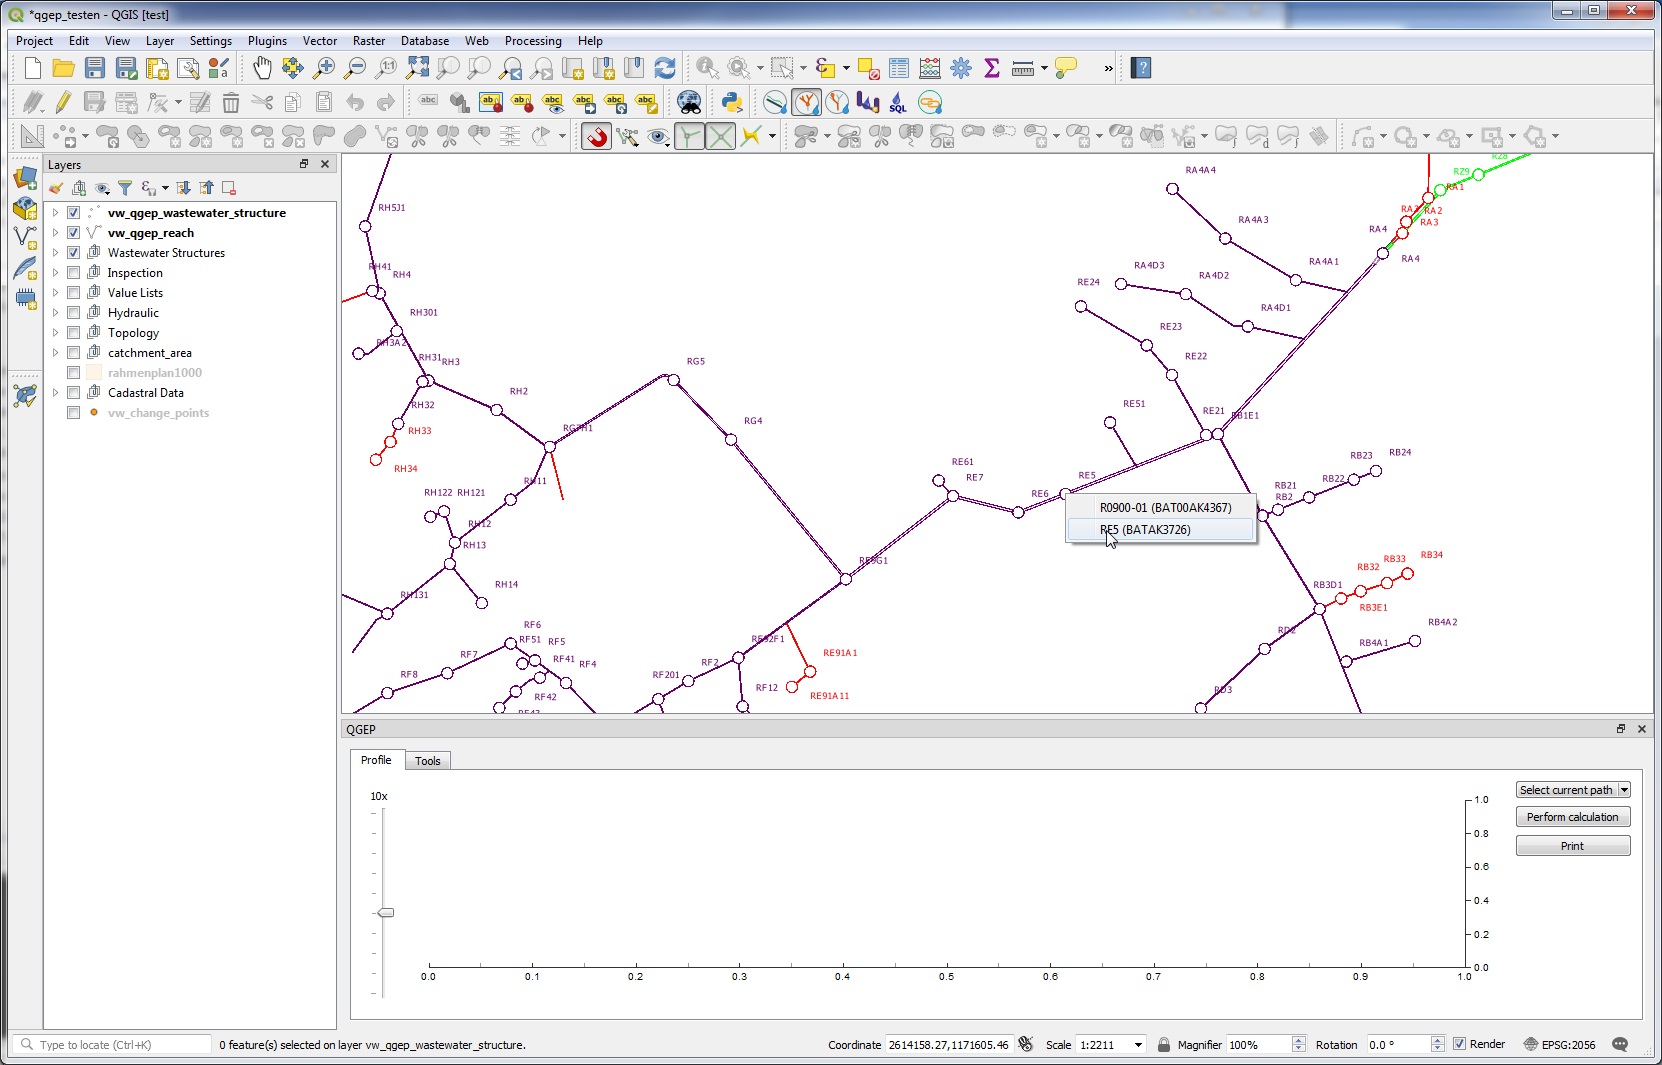
After a few seconds all upstream reaches will be highlighted and you can see where the water is coming from.
If you want to select the highlighted reaches, then click on the Select current path button in the profile window
You can now work with your reach selection in the attribute table or zoom to the selected reaches (if the vw_qgep_reach layer is selected)
Use this tool to check if the topology of your network is correct.
Note
In the button select current path, you have a menu Configure Select. This is prepared to select later not only the path, put also the catchment areas that are connected to the path. This feature is not working with qgepplugin 1.1.8.
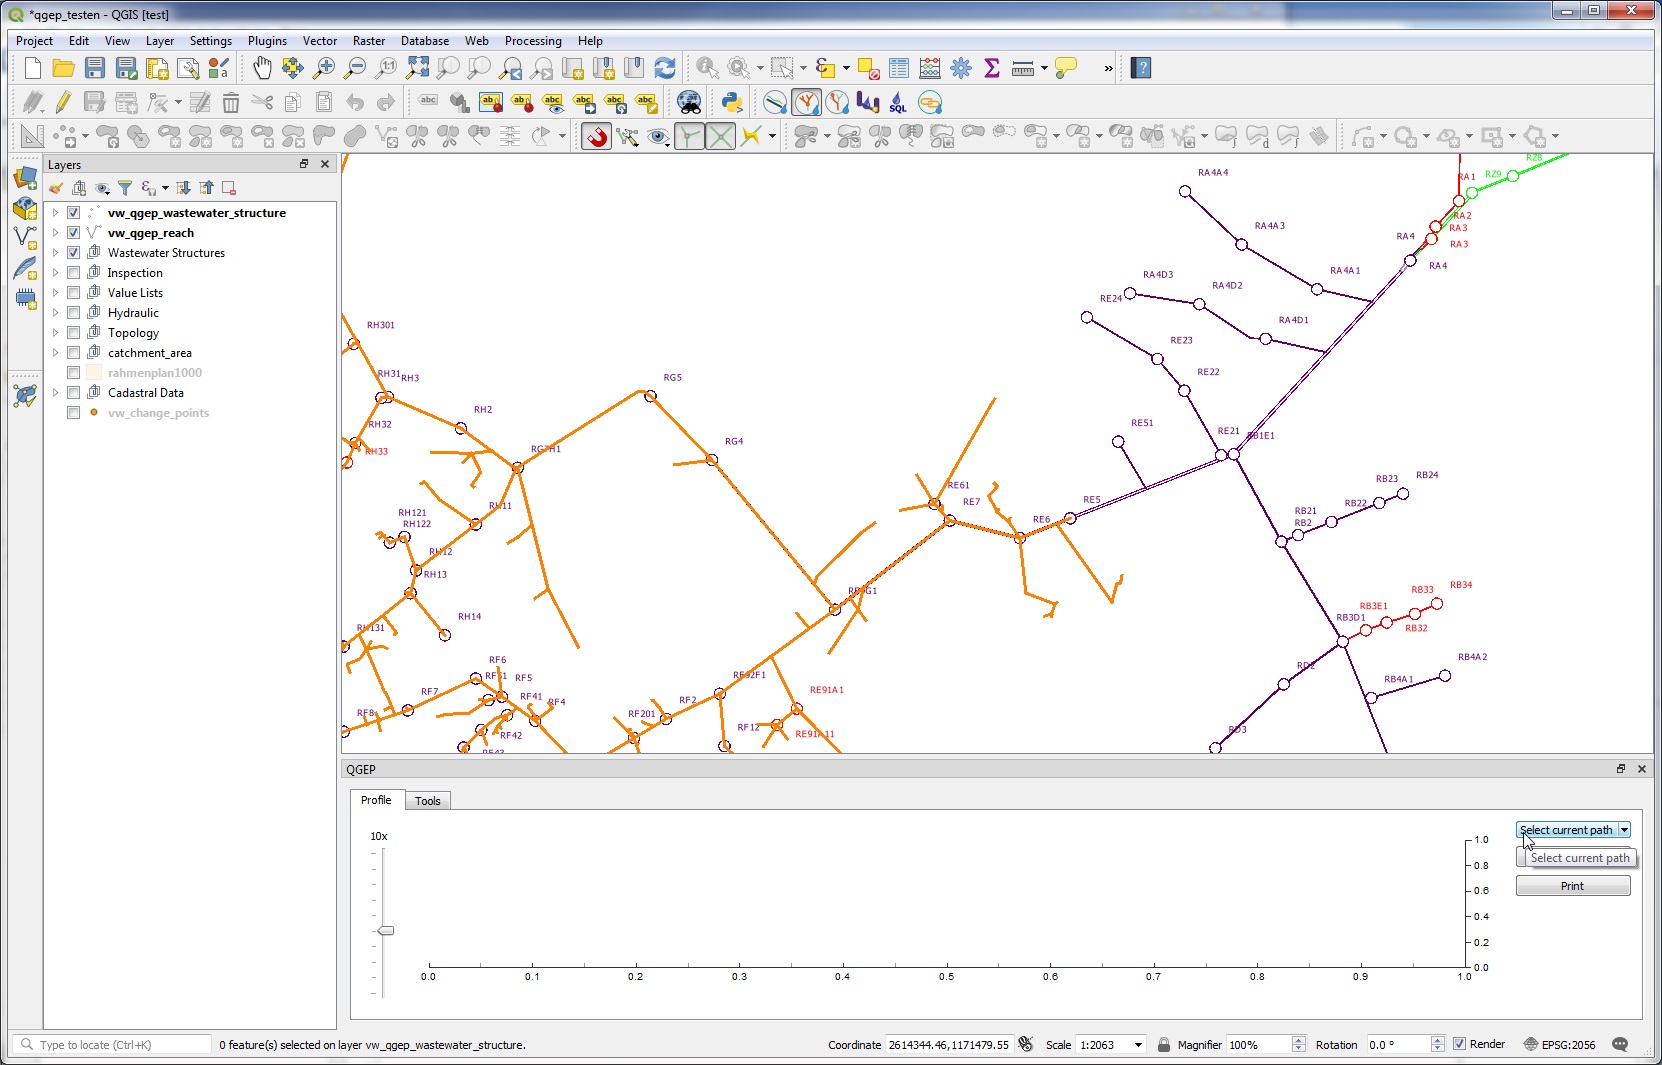
3.5.3. Downstream
Downstream network following works similar as the Upstream network following described above.
You can see where the water is going to.
Control, if QGEP finds also the overflows
Use this to check whether the topology of your network is correct or to find out where you could intervene in case of an accident.
3.5.4. Sum up upstream
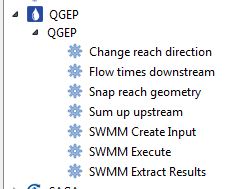
This is a tool in the QGEP-toolbox.
The idea for this tool is to sum up a value over the whole network of channels, e.g. the flowtime for each point to the outlet of the network.
For this tool you need a field in the layer vw_qgep_reach with the values to sum up. Because interesting values are normally not part of this layer, you have first to join the value-field (e.g flowtime or flow rate) to the layer vw_qgep_reach.
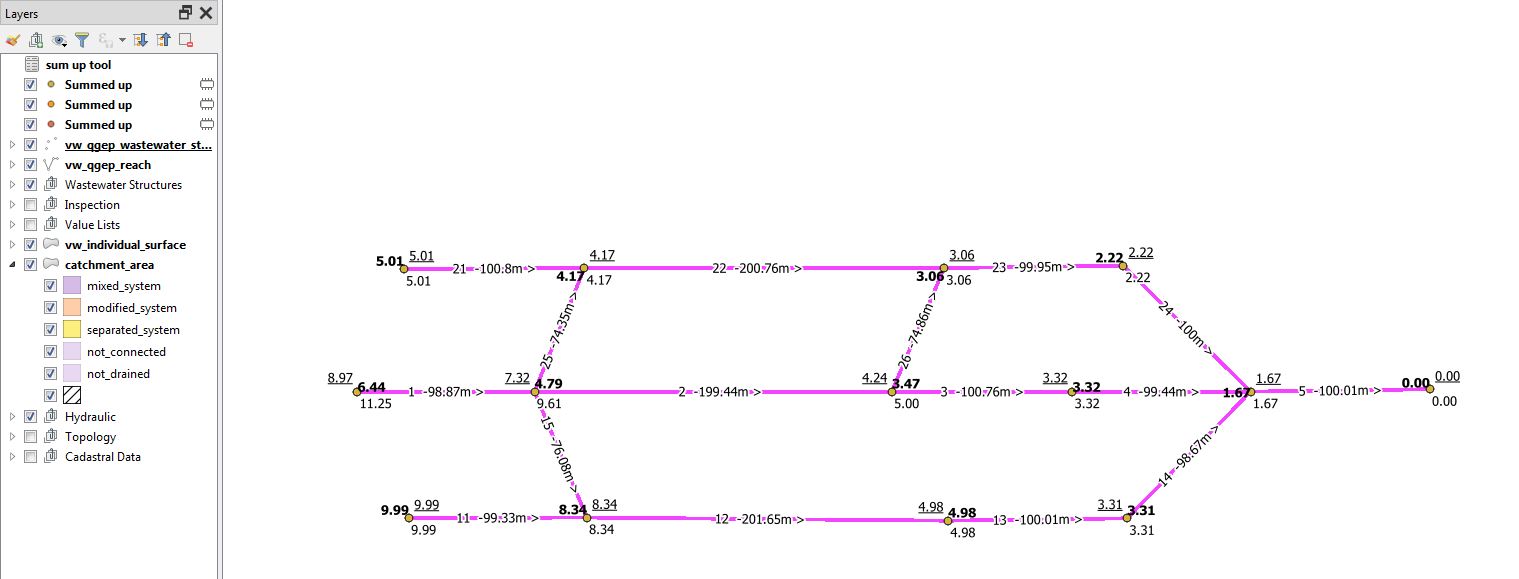
As example look at this small network, labeled with reach-identifier, length and flow direction arrow
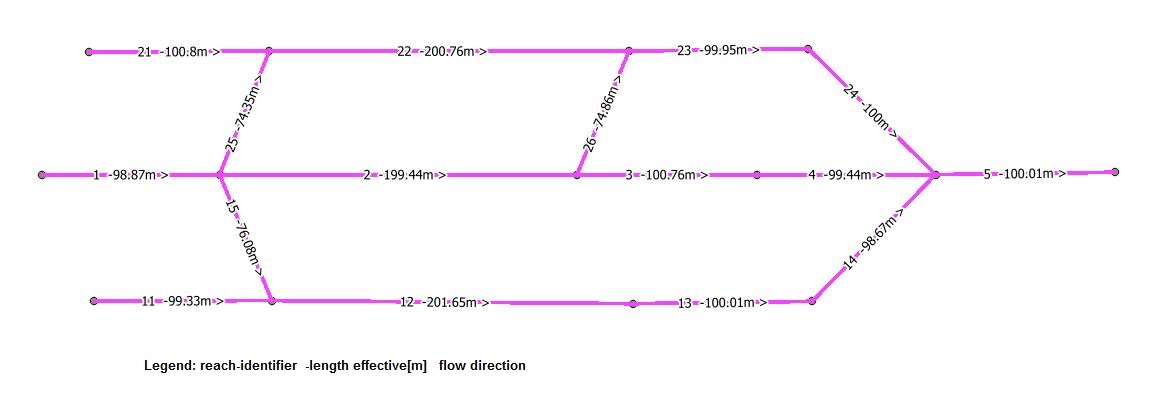
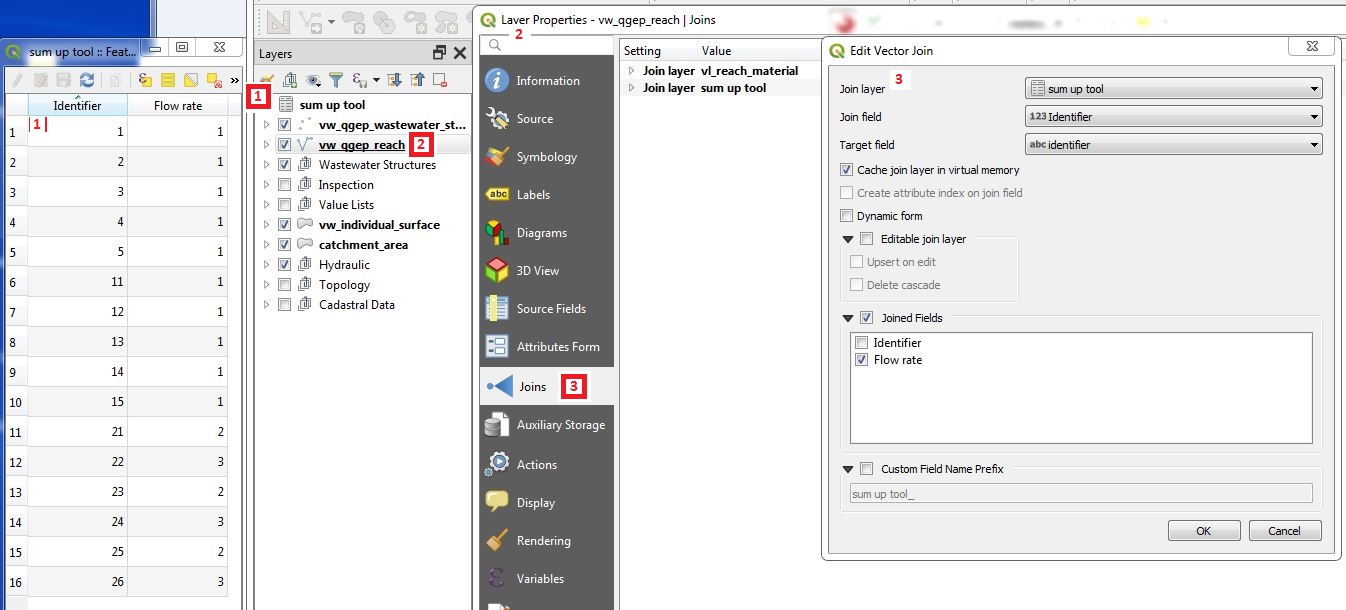
We need a table (in the example called sum up tool) with at least two fields: field identifier for the join and field flow rate (in the example in [m/s]) to sum up.
Open the properties of layer vw_qgep_reach, choose Joins and Add new join (green + Button) and define the join with the join field (identifier) and the joined fields (field to sum up).
Start the tool with double-click one Sum up upstream

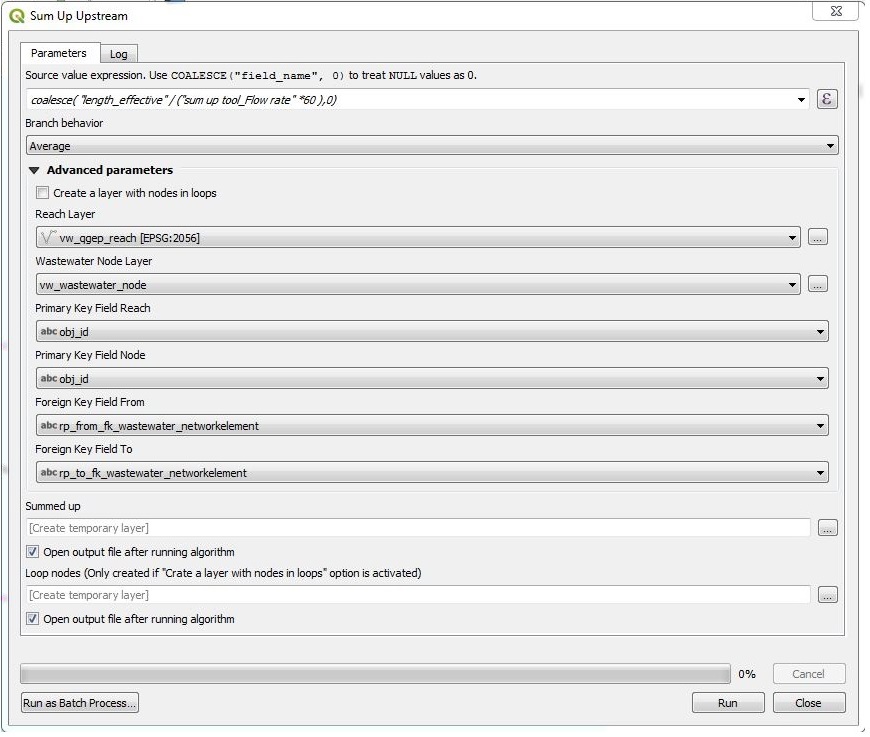
In the window you have to enter/to choose
an expression as shown in the title of the field (COALESCE(“field_name”,0). If you do not use the coalesce command, you will get an error when running the tool and there are NULL-values in the field to sum up. In the figure is as example the calculation for the flow time in [minutes], calculated with length effective and the flow rate in [m/s].
the branch behavior (Minimum, Maximum, Average): which value will be used after when two branches join to continue the summing.
the advanced parameters are preconfigured for QGEP and should not need to be changed.
Summed up: if you let this field empty, there will be a temporary point layer with the results in your project. Otherwise you can save the results to a new point vector layer.
The resulting point-vector layer has the fields of the vw_wastewater_node layer and an additional field value with the sum for each wastewater node. * In the figure below you see the result of the example with all three branch behaviors: minimum = normal style, maximum = bold, average = underscored
3.5.5. Flow times downstream
This is a tool in the QGEP-toolbox.
The idea for this tool is to get the flowtime between a startpoint (where e.g.is an accident) and an interesting wastewater structure downstreams. It is not the idea to create a flowtime plan for a whole network with this tool (use the SumUpTool_ tool for this task).
For this tool you need a layer (table) in the QGEP-project with the flowtime per reach and the obj_id of the reach.
You have to select the start-reach (where the accident is) in the vw_qgep_reach-layer
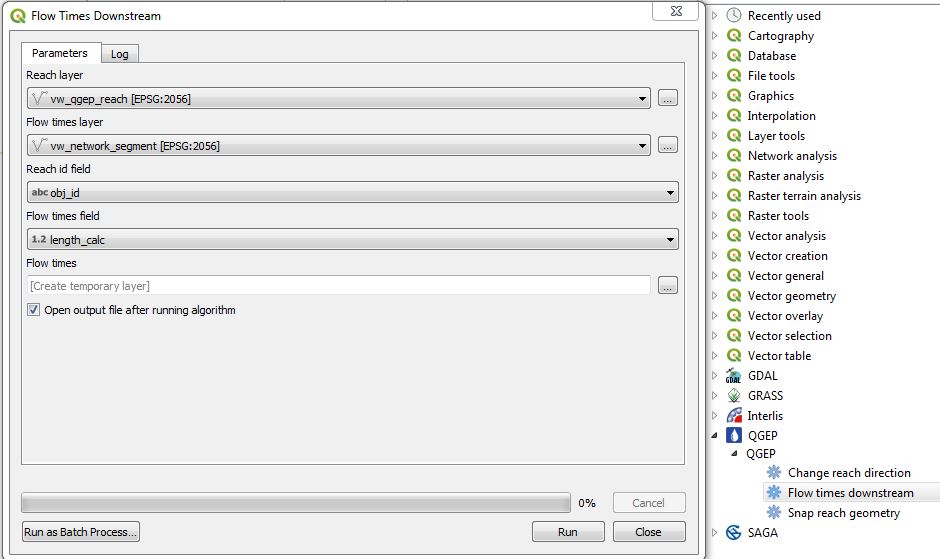
Start the tool with double-click one Flow times downstream
In the window you have to choose
as reach layer: vw_qgep_reach
as flow time layer: your table with the reach obj_id and the flowtimes (or the values you want to sum-up downstream)
as reach id field: the field in your table that is the obj_id of the reach
as Flow times field: the field in your table, that you want to sum-up
as Flow times: if you let this field empty, there will be a temporary file with the results in your projects. Otherwise you can save the results to a vector layer.
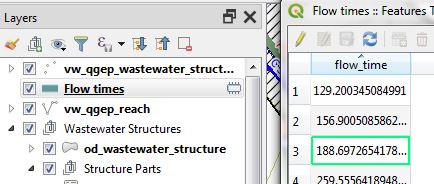
The tool makes a downstream network search starting with the selected reach and creates for every reach a record in the (temporary) vector layer with just one field (the sum of the Flow times).
Attention
If there is more than one downstream-way, the results are wrong after the branch.
There are some cases, where you get an empty flow time-Layer and red (error) text in the Log-window:
Do not select more than one reach to start
Do not select vw_qgep_reach as flow time layer (to sum-up the length, use the vw_network_segment layer)
If the reach id field has no values that match the reach obj_id, you will also get an error